
- WAN names now appear in Ethernet Port Details (and the API) for instant port identification.
- Offline LAN clients no longer show as online; wireless clients display their PPSK name.
The Status tab is where you prove what the network is doing — the last tab in the Balance UI.
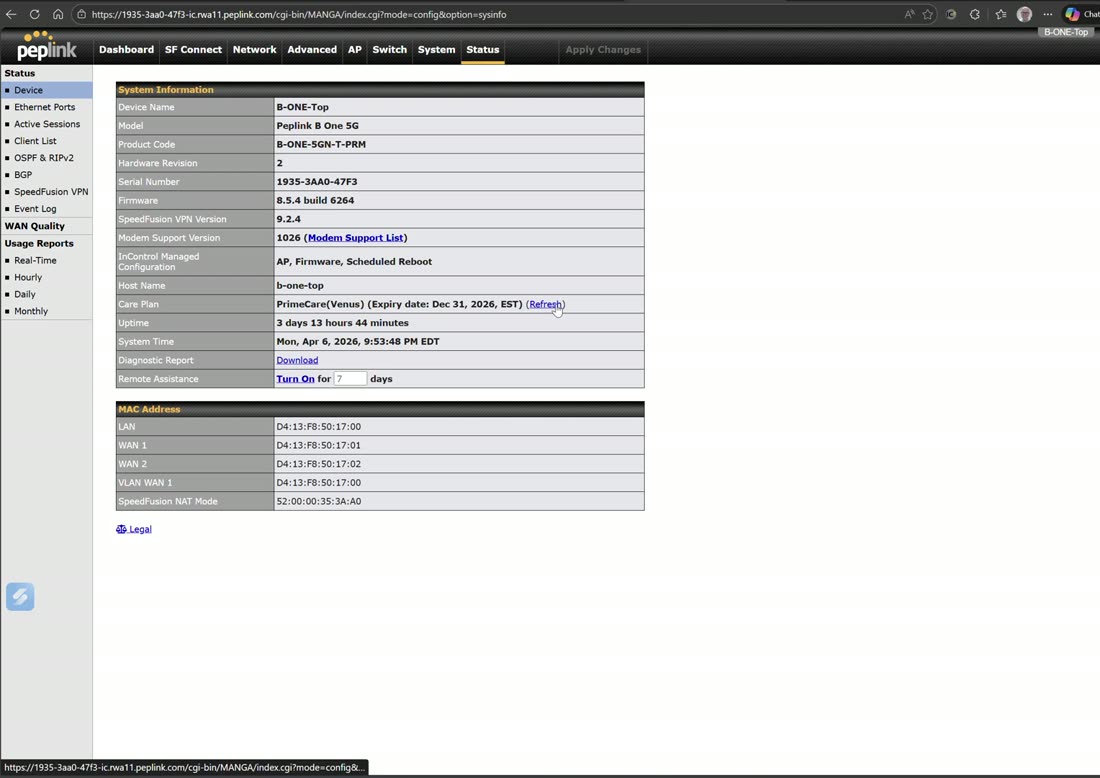
Device Status lets you download a diagnostic report, enable remote assistance, refresh your care plan, and update the modem list. From here you can also open a graphical view of the Ethernet ports.
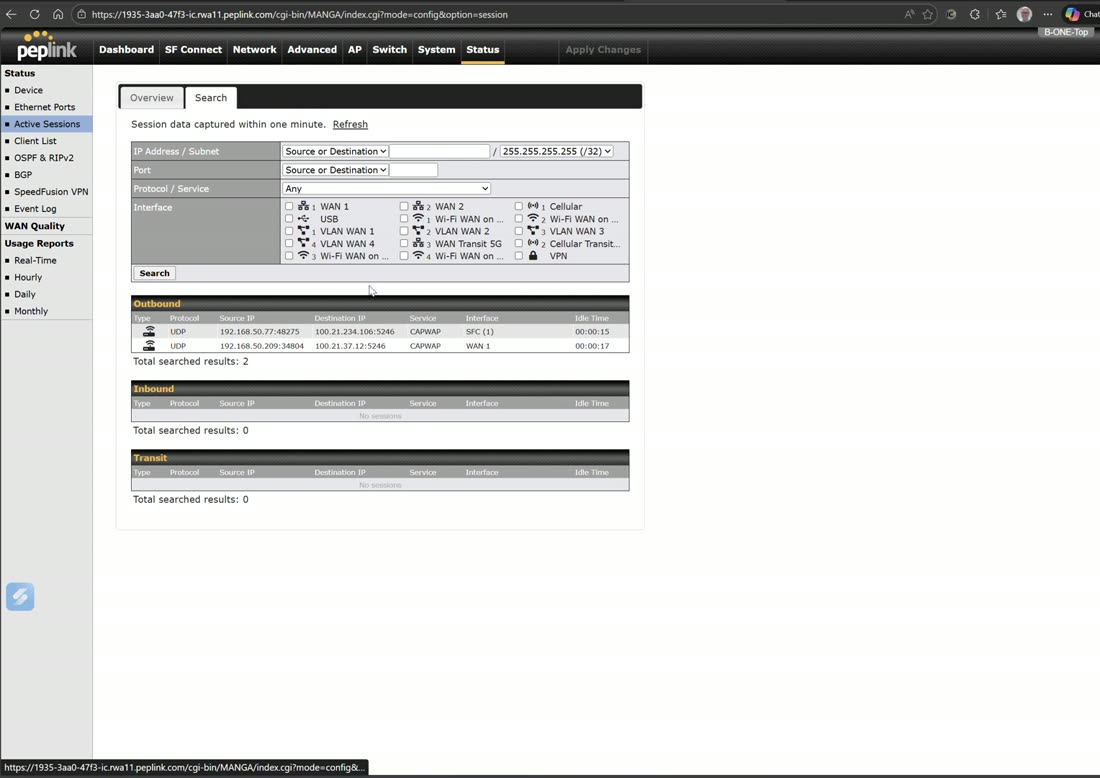
Active Sessions shows what is actually happening on the network right now — search and refresh to watch live traffic.
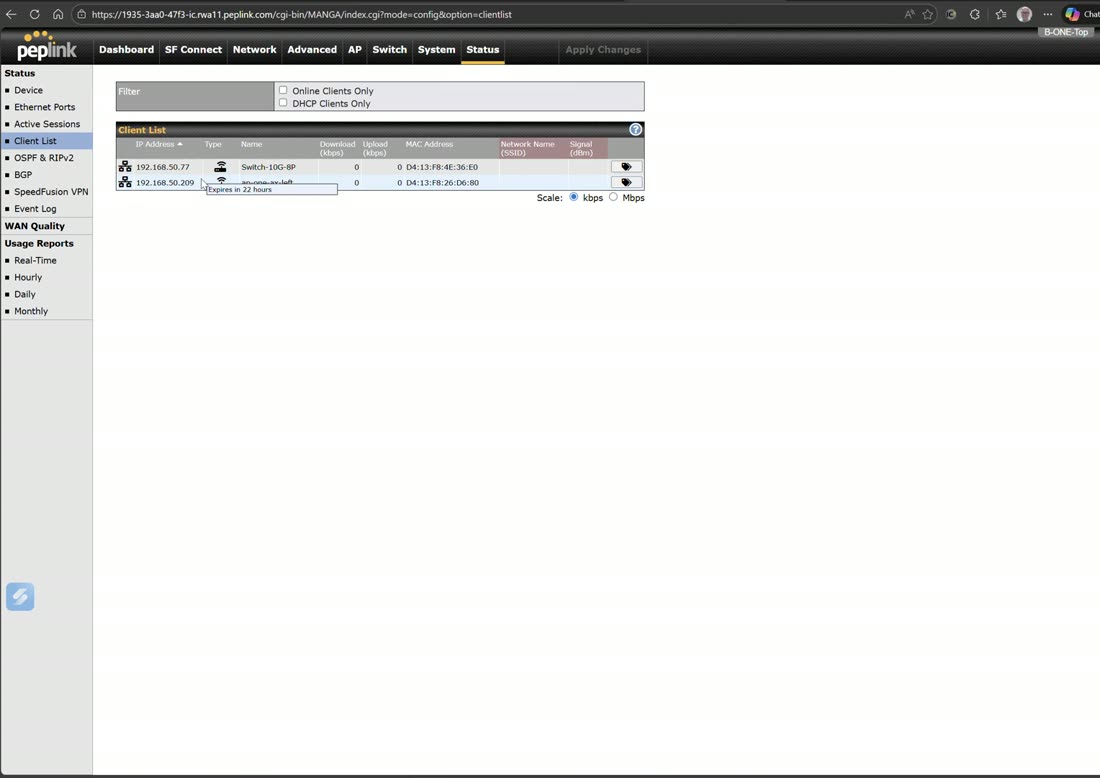
Client List shows every device currently connected to the router, including attached APs and switches. Alongside it you’ll find OSPF and BGP status, which stay blank unless those protocols are configured.
SpeedFusion status & the live bonding test
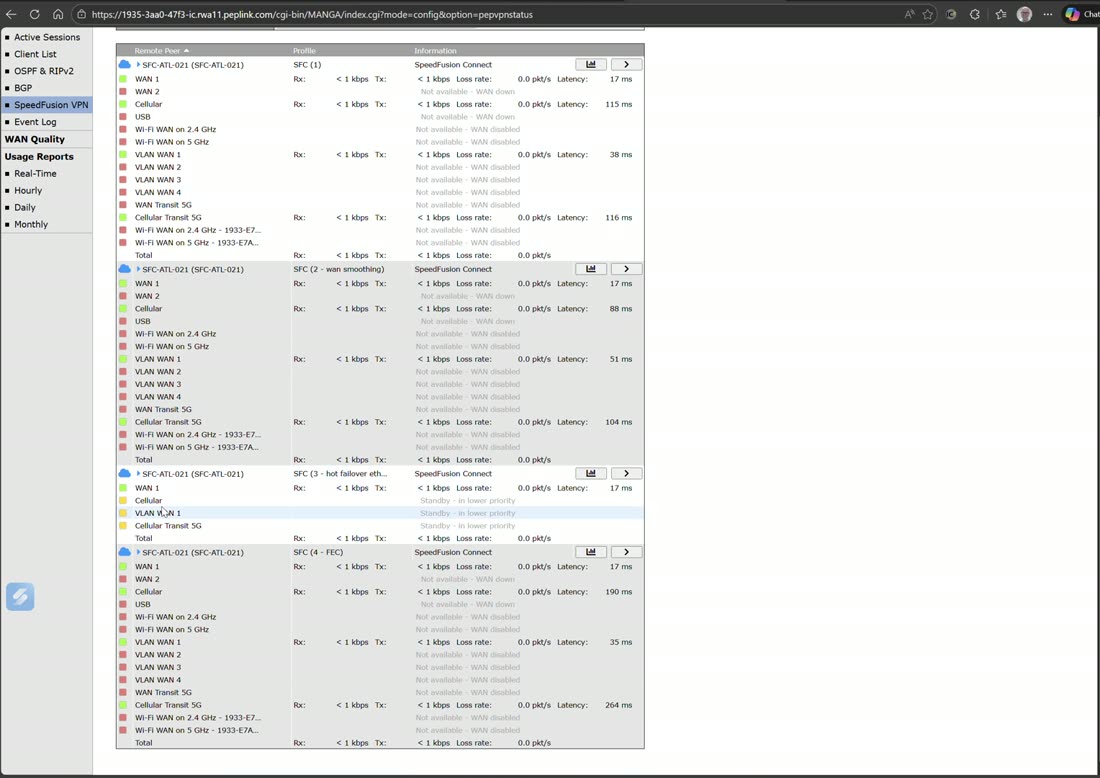
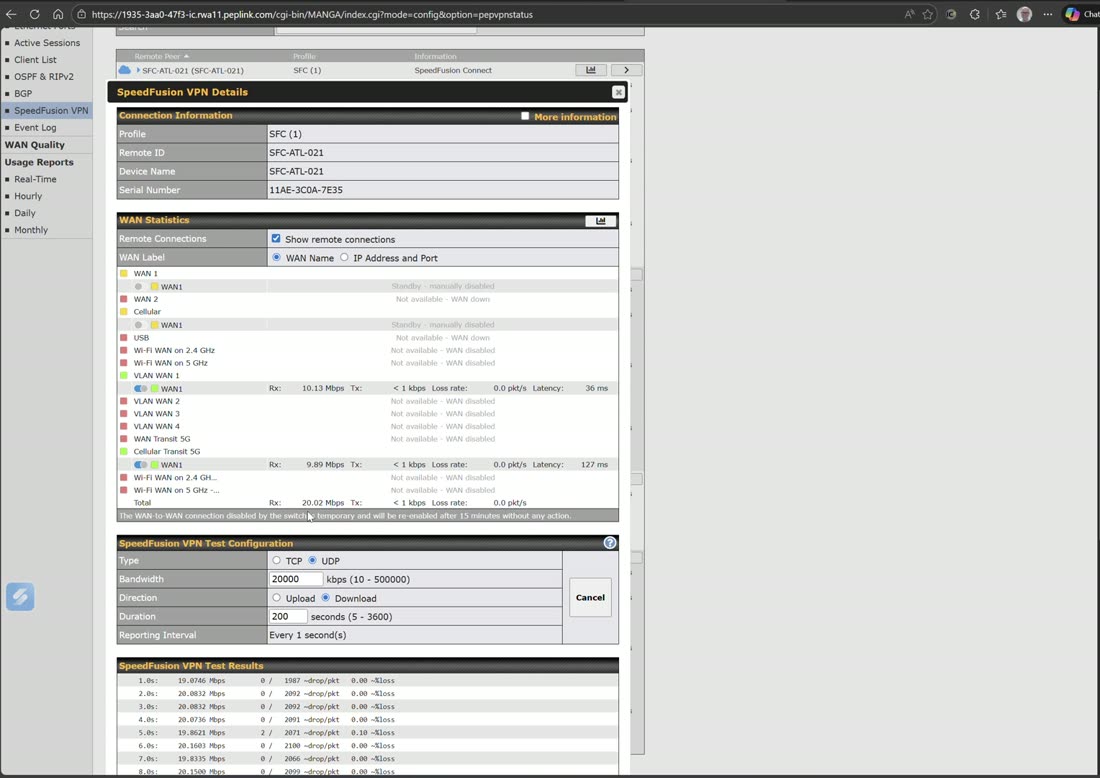
SpeedFusion VPN status shows every tunnel at once — in the walkthrough that meant the SpeedFusion Connect bonding tunnel, the WAN-smoothing tunnel, the hot-failover tunnel (with its WAN 1, cellular 1, Starlink, and Transit 5G cellular 2 members visible), and the FEC tunnel. Click the little chart icon on any tunnel to open a real-time bandwidth graphic showing overall statistics and each WAN.
The best troubleshooting tool on the box
Expand a tunnel, choose a protocol and rate (e.g. UDP at 20 Mbps) and a duration (e.g. 200 seconds), run a download or upload test, then physically drop WANs one at a time. Watch the bonded pipe hold the target rate as you turn off a cellular, then another, then Starlink — losing only tiny amounts of data. The chart shows latency, packet loss, out-of-order packets, and the live distribution across every WAN, so you can confirm each failure scenario still delivers the rate your application needs.
Logs, quality & usage
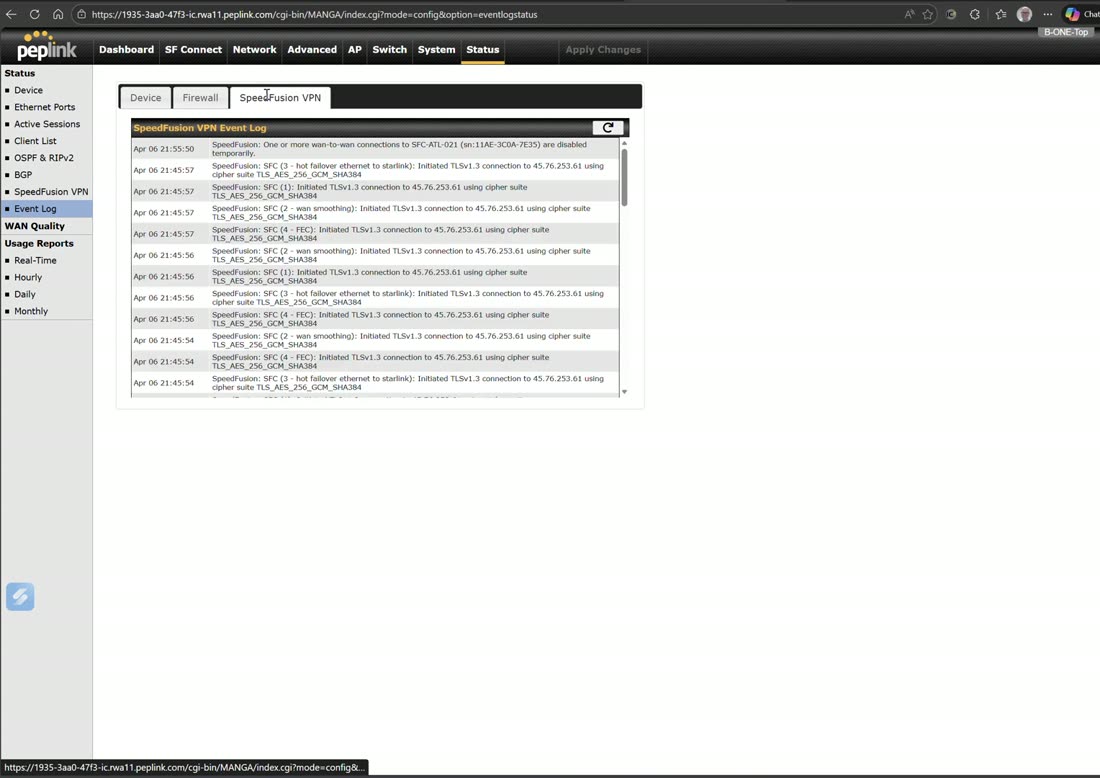
The Event Log separates device, firewall, and SpeedFusion events, with IPsec, GRE, and other firewall logs appearing when those features are in use.
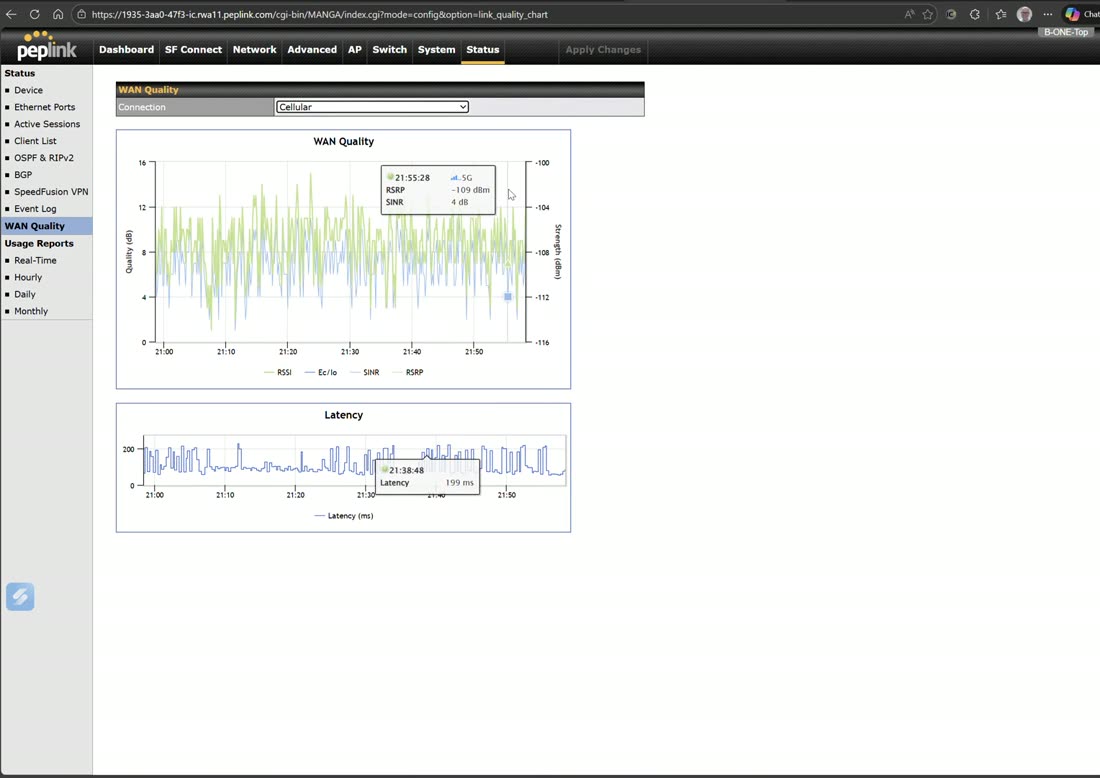
WAN Quality lets you look at each WAN individually — it measures out to the third hop, so you can compare, say, a clean fiber WAN 1 against a cellular link and even drill into VLAN-as-WAN interfaces.
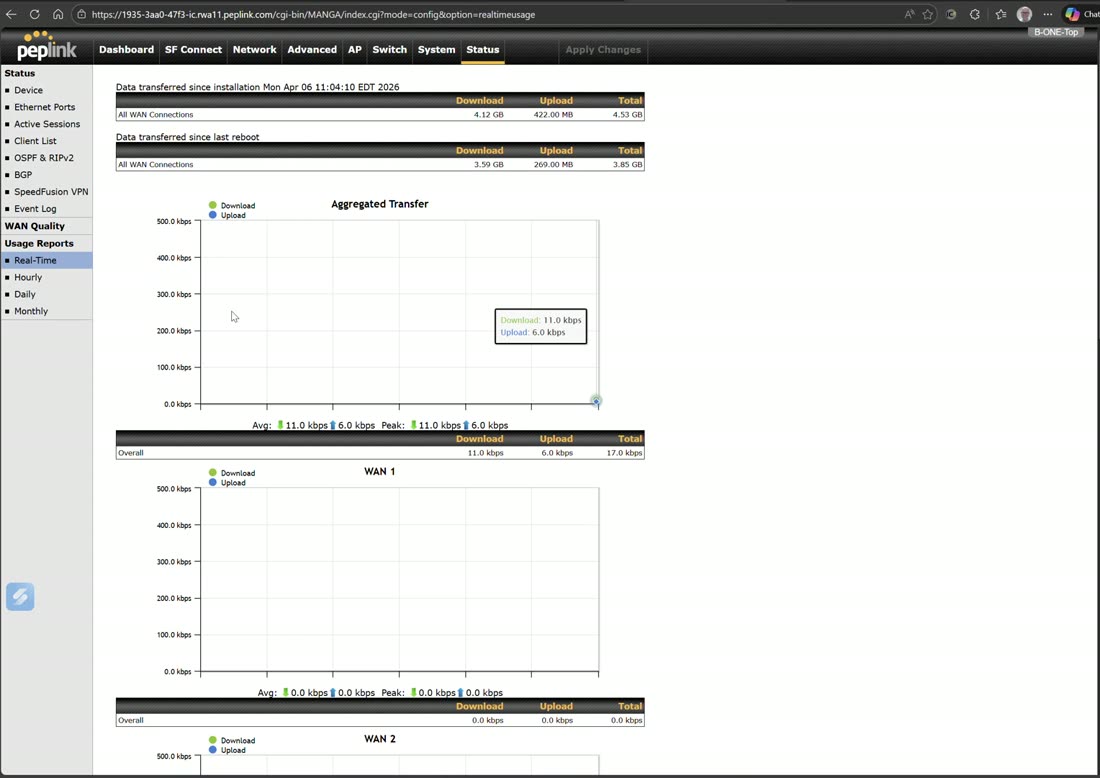
Usage Reports come in real-time, hourly, daily, and monthly views.
Hidden depth: support.cgi
Change the word index to support in the address bar to reach an advanced menu — view detailed LAN and WAN details, check for crashes and errors, run a network capture (capped at 20 MB locally, or perpetual when done remotely), and run remote cellular firmware updates to see whether any of your cellular modems have newer firmware available.
Watch: related training videos
- Support | How to Conduct WAN Analysis (Peplink University, 4 min)
- Support | How to Use the WAN Quality Report Feature (Peplink University, 10 min)
- Support | How to Use Peplink’s Active Sessions (Peplink University, 2 min)
- Browse the full Video Library →