
Enter a group (cream) for the day-to-day view of a site’s devices. In Control is broken into three levels — organization (orange), group (cream), and device (white) — and the menu icon colour tells you which level you are in. A group is a collection of devices, and the reports and dashboard here are scoped to just those devices.
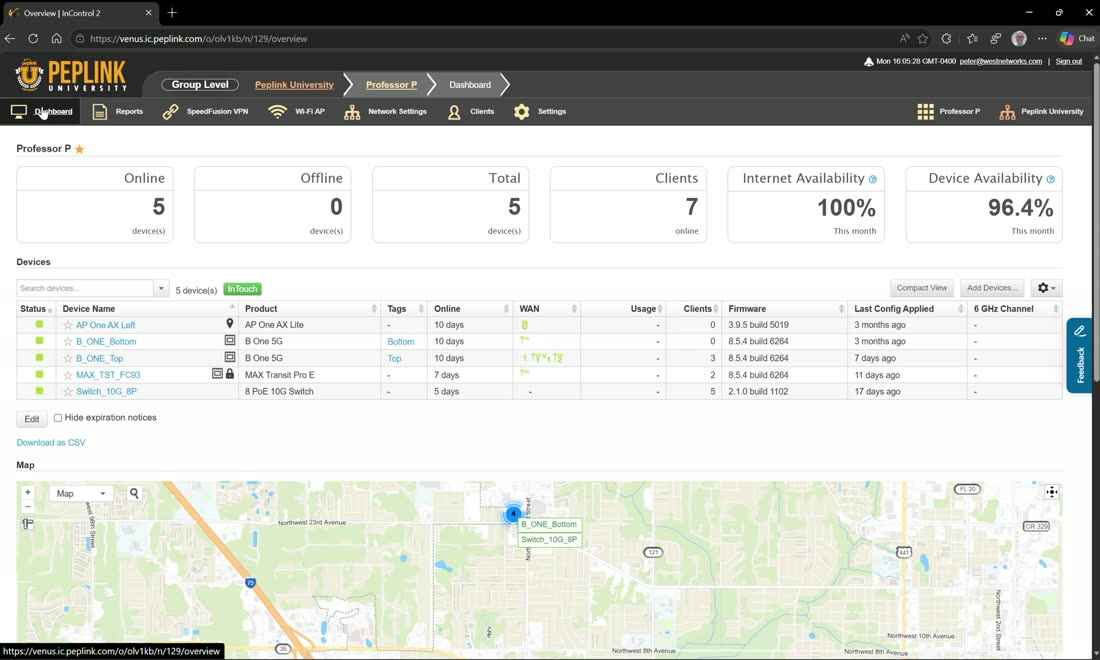
Reports
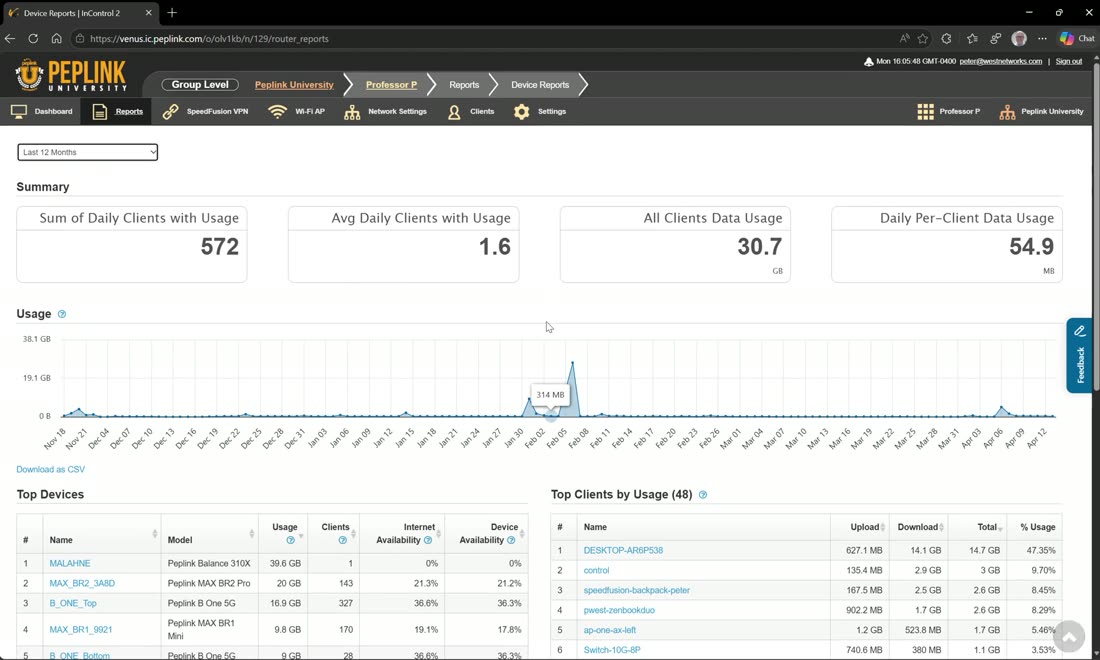
Device reports give you an executive summary of all your usage over the last 7, 30, 90, 180, or 365 days (up to 12 months). Ask for a device’s usage over the last 12 months and you get a full chart of everything that ran across it in that window.
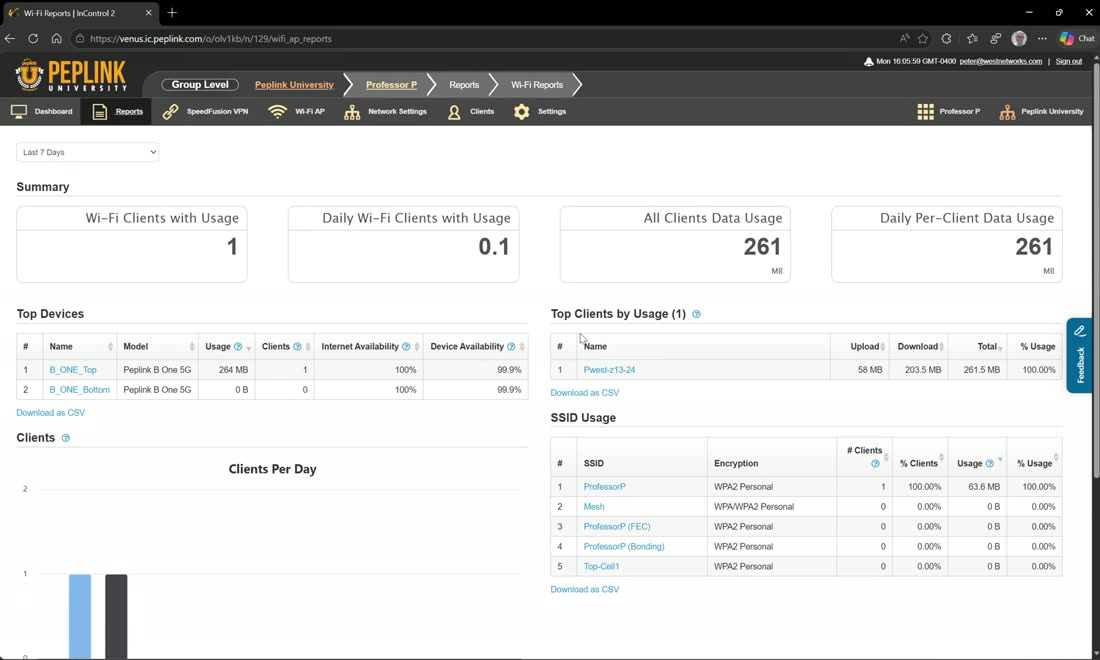
Wi-Fi reports do the same thing but for Wi-Fi analytics — genuinely useful reports to hand to executives. Everything can be downloaded as a CSV so you can build your own reports on top of it.
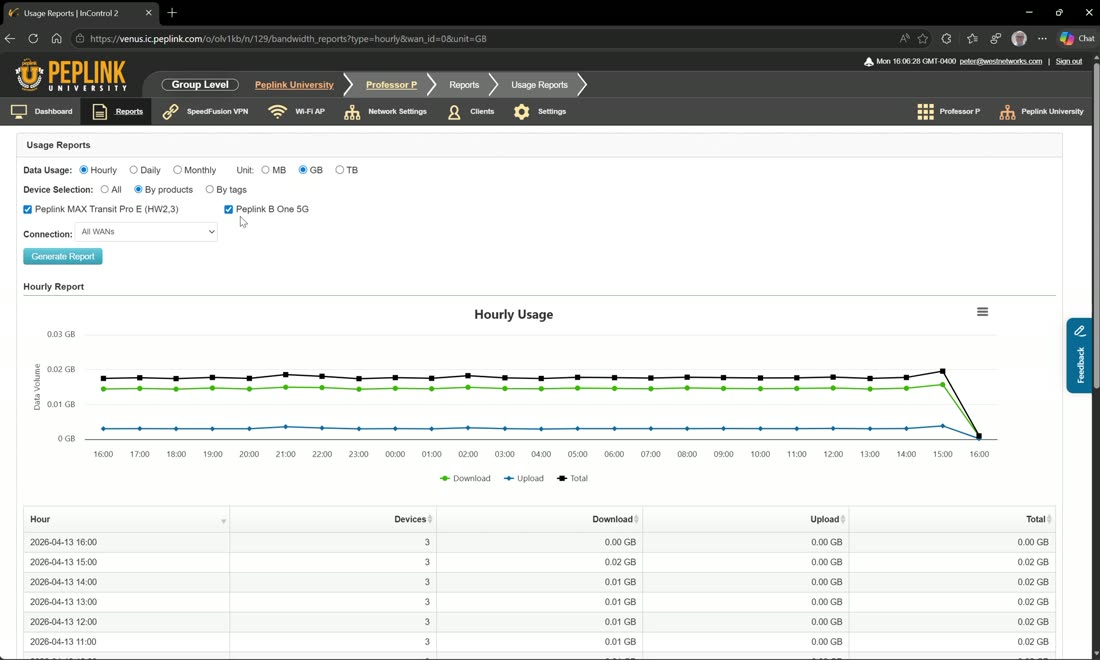
Usage reports are a workhorse for troubleshooting — used all the time. View hourly, daily, or monthly; switch the scale between megabytes, gigabytes, or terabytes; and filter by device, by product (e.g. show just the MAX Transit Pro E, or just the B1 5G), or by tag (show every device carrying a given tag).
Group vs. device level
There is a difference between the group-level usage reports and the device level. At the device level you get more options tied to that specific device — including real-time and per-minute views on top of hourly/daily/monthly, so you can watch a speed test as it runs. The device level also adds a site survey report (5G routers) that lists every carrier, signal, band and frequency in the area.
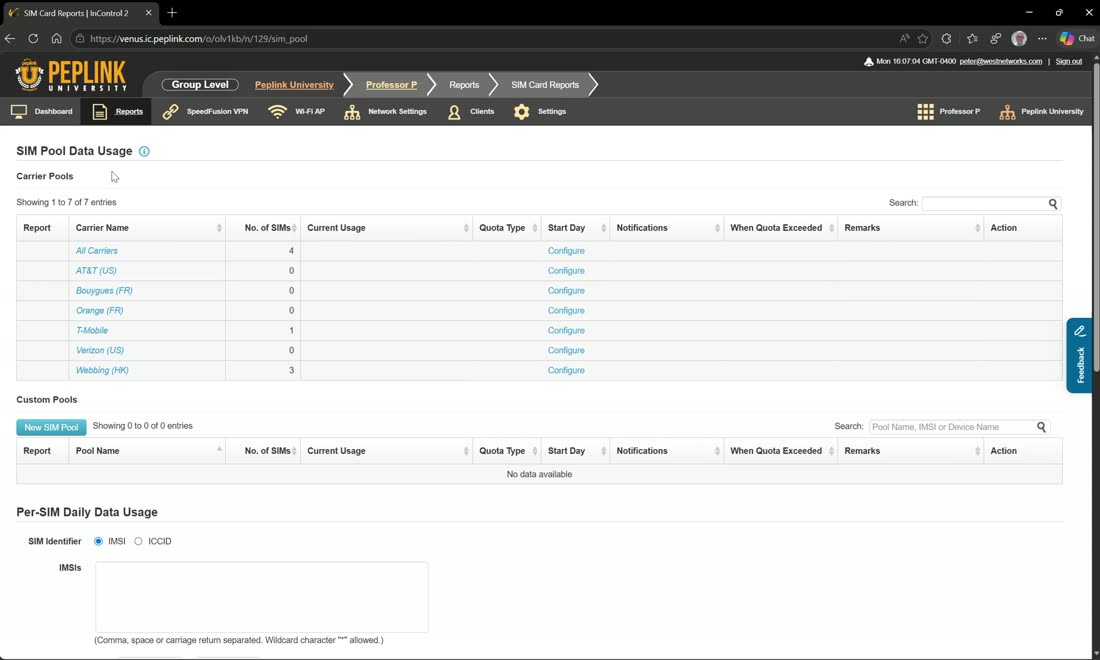
SIM card reports show every SIM card in the group — where each one is and which device it sits in. The group’s reports menu also includes Starlink data pools, captive portal dashboard and reports, and connection test reports (the results of any scheduled connection tests you have set up).
Event log, tags & clients
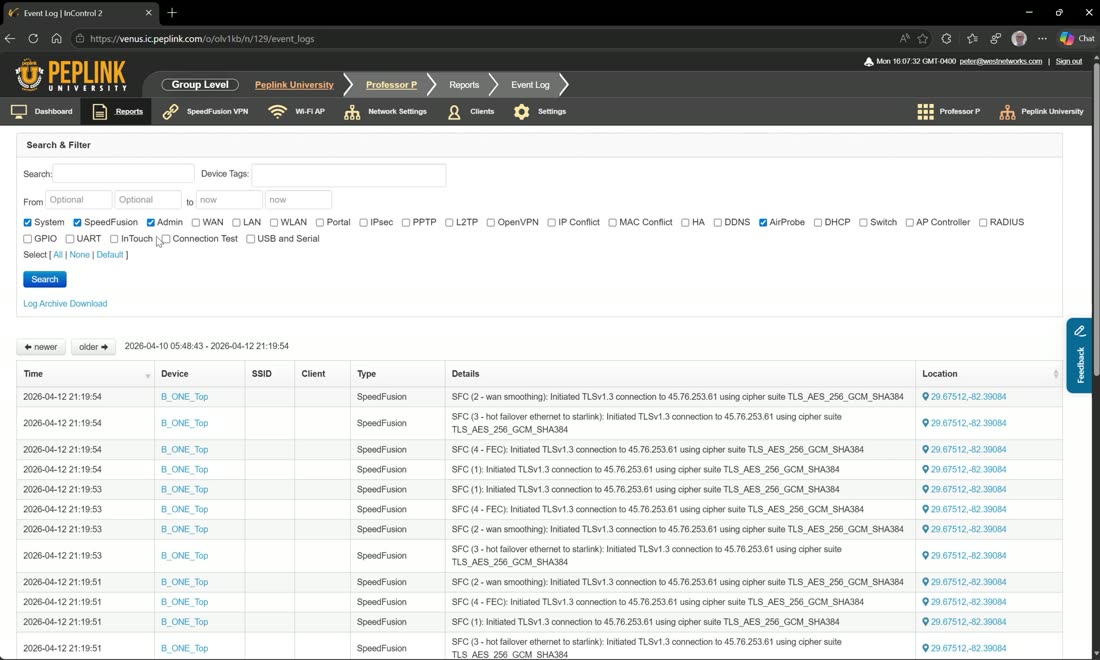
The event log lets you see everything happening across the group’s devices — hit “show all” and search to see everything going on in the network. Tags let you manage tags and see where they are used across the group.
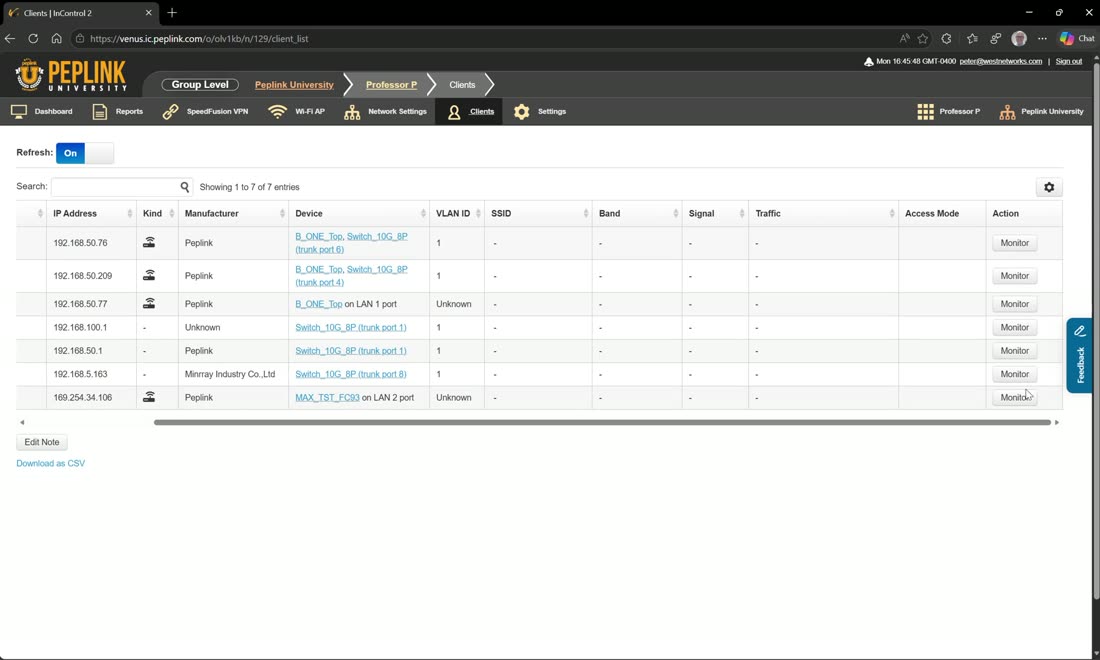
The clients view shows every device across the group, and from here you can also monitor those devices. Thanks to LLDP (new in 2.14.2), you see the exact LAN port each device is on — for example a switch showing on the B1 top’s LAN 1 and a Transit Pro E on LAN 2.